Newsletter signup

Just simple MailerLite form!

Please wait...

Thank you for sign up!

Image Analysis

Keep the keepers. Cull the rest.

A built-in quality analysis tool that evaluates individual sub-exposures. Drag and drop a FITS or XISF file and get immediate, quantified feedback on your optical system’s performance.

Single-Image Analysis

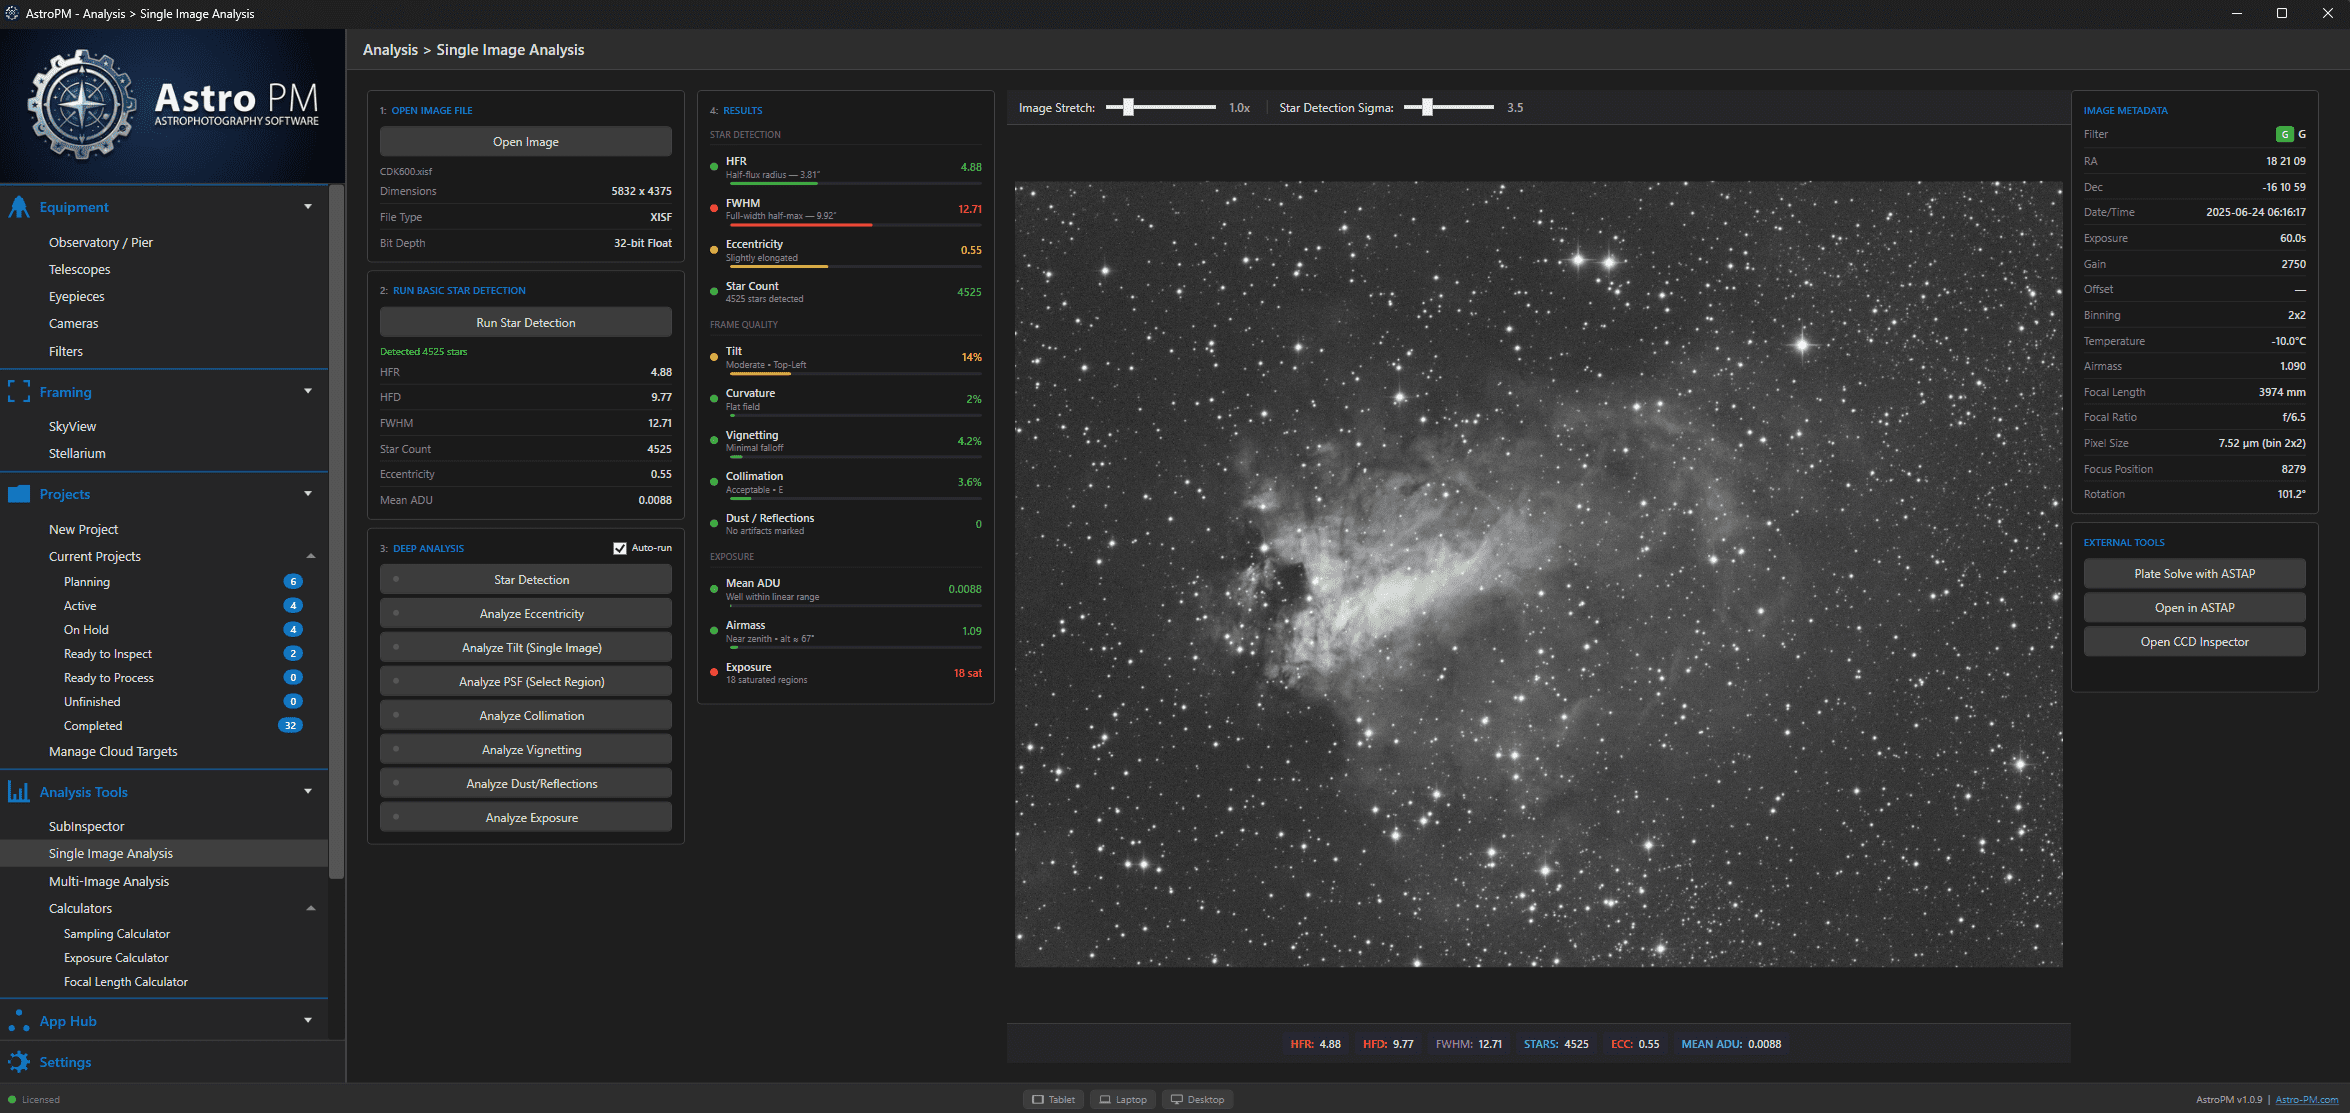
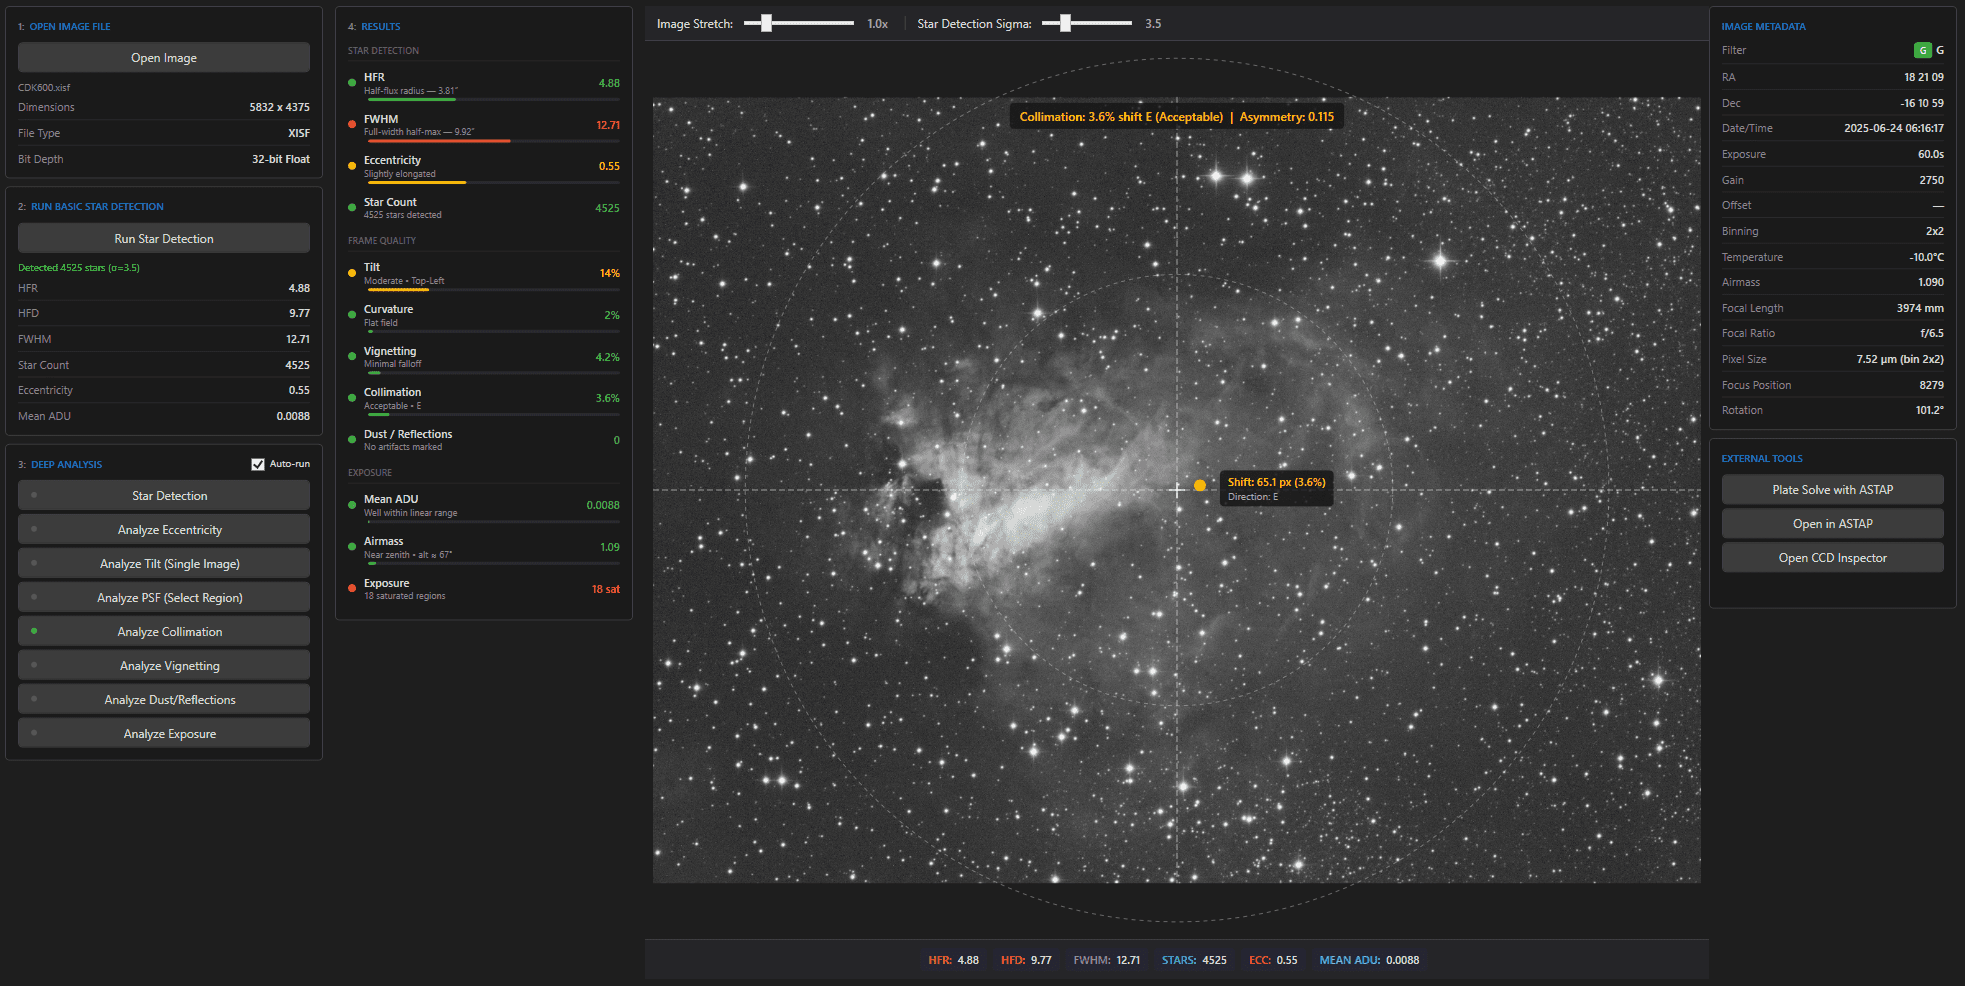
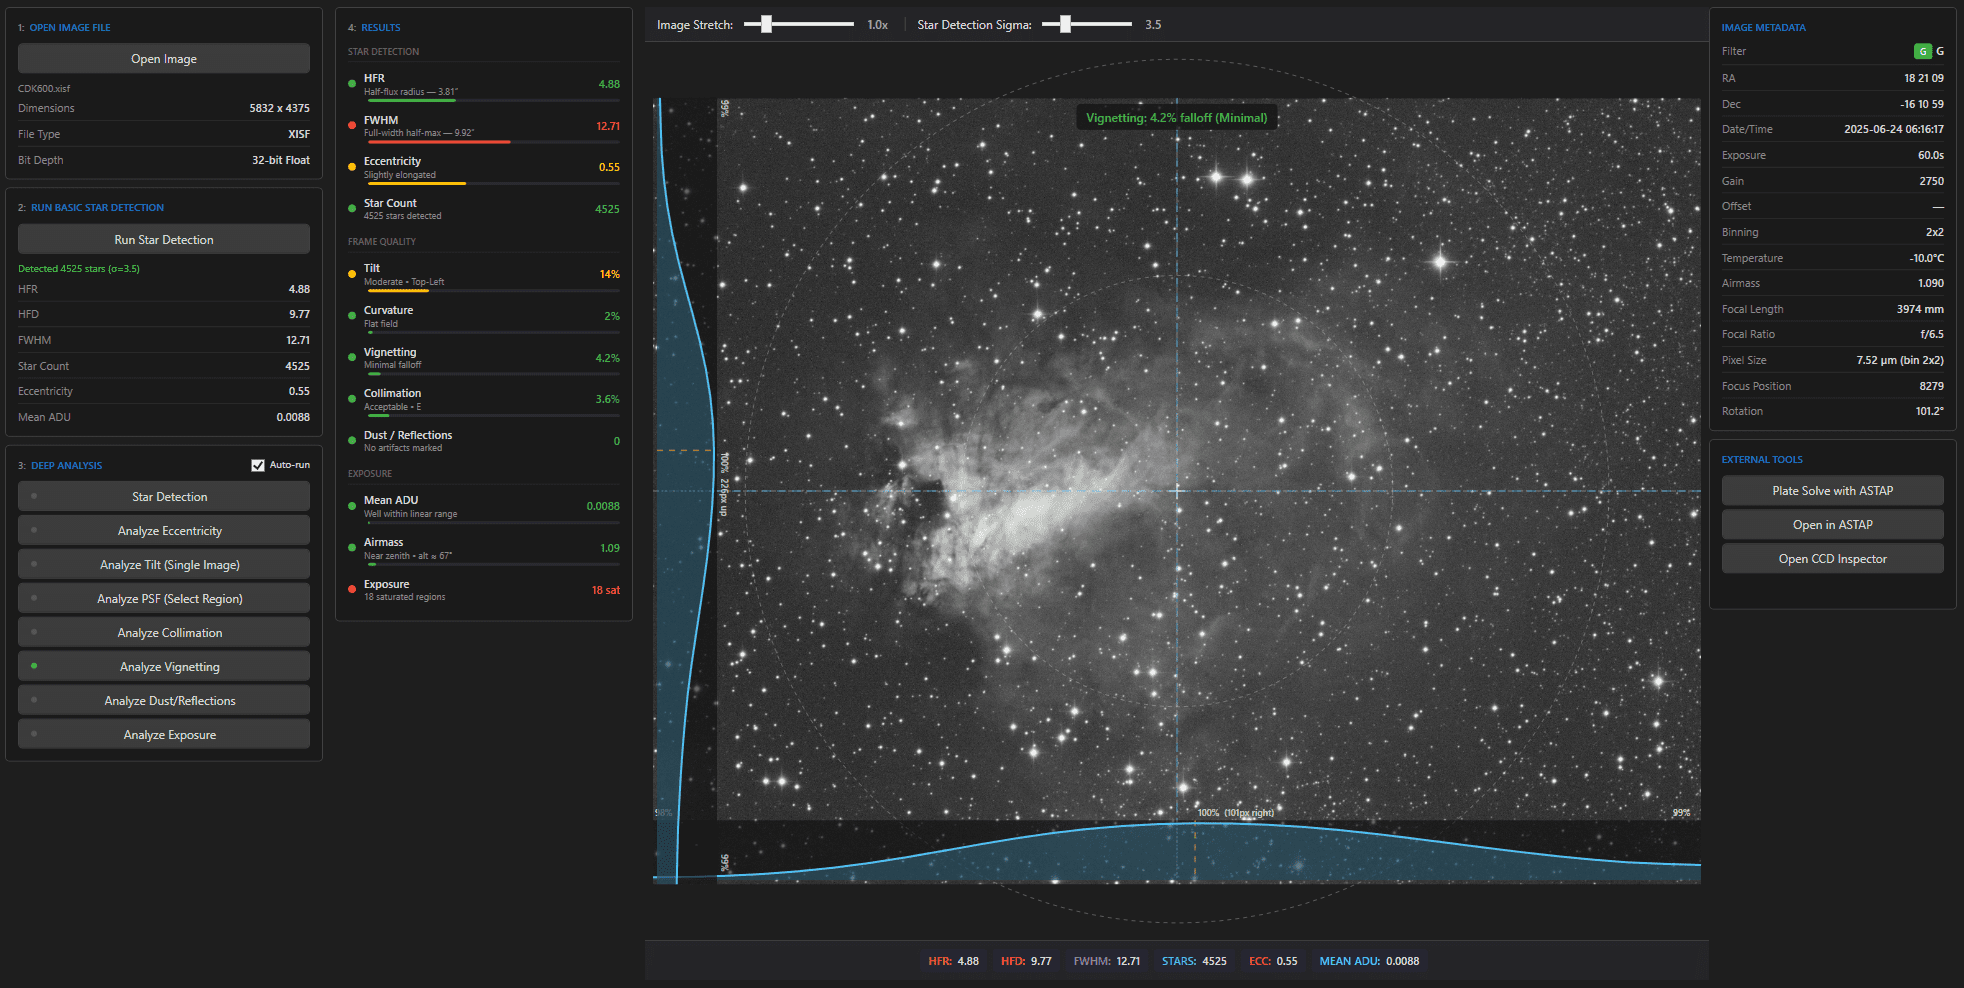
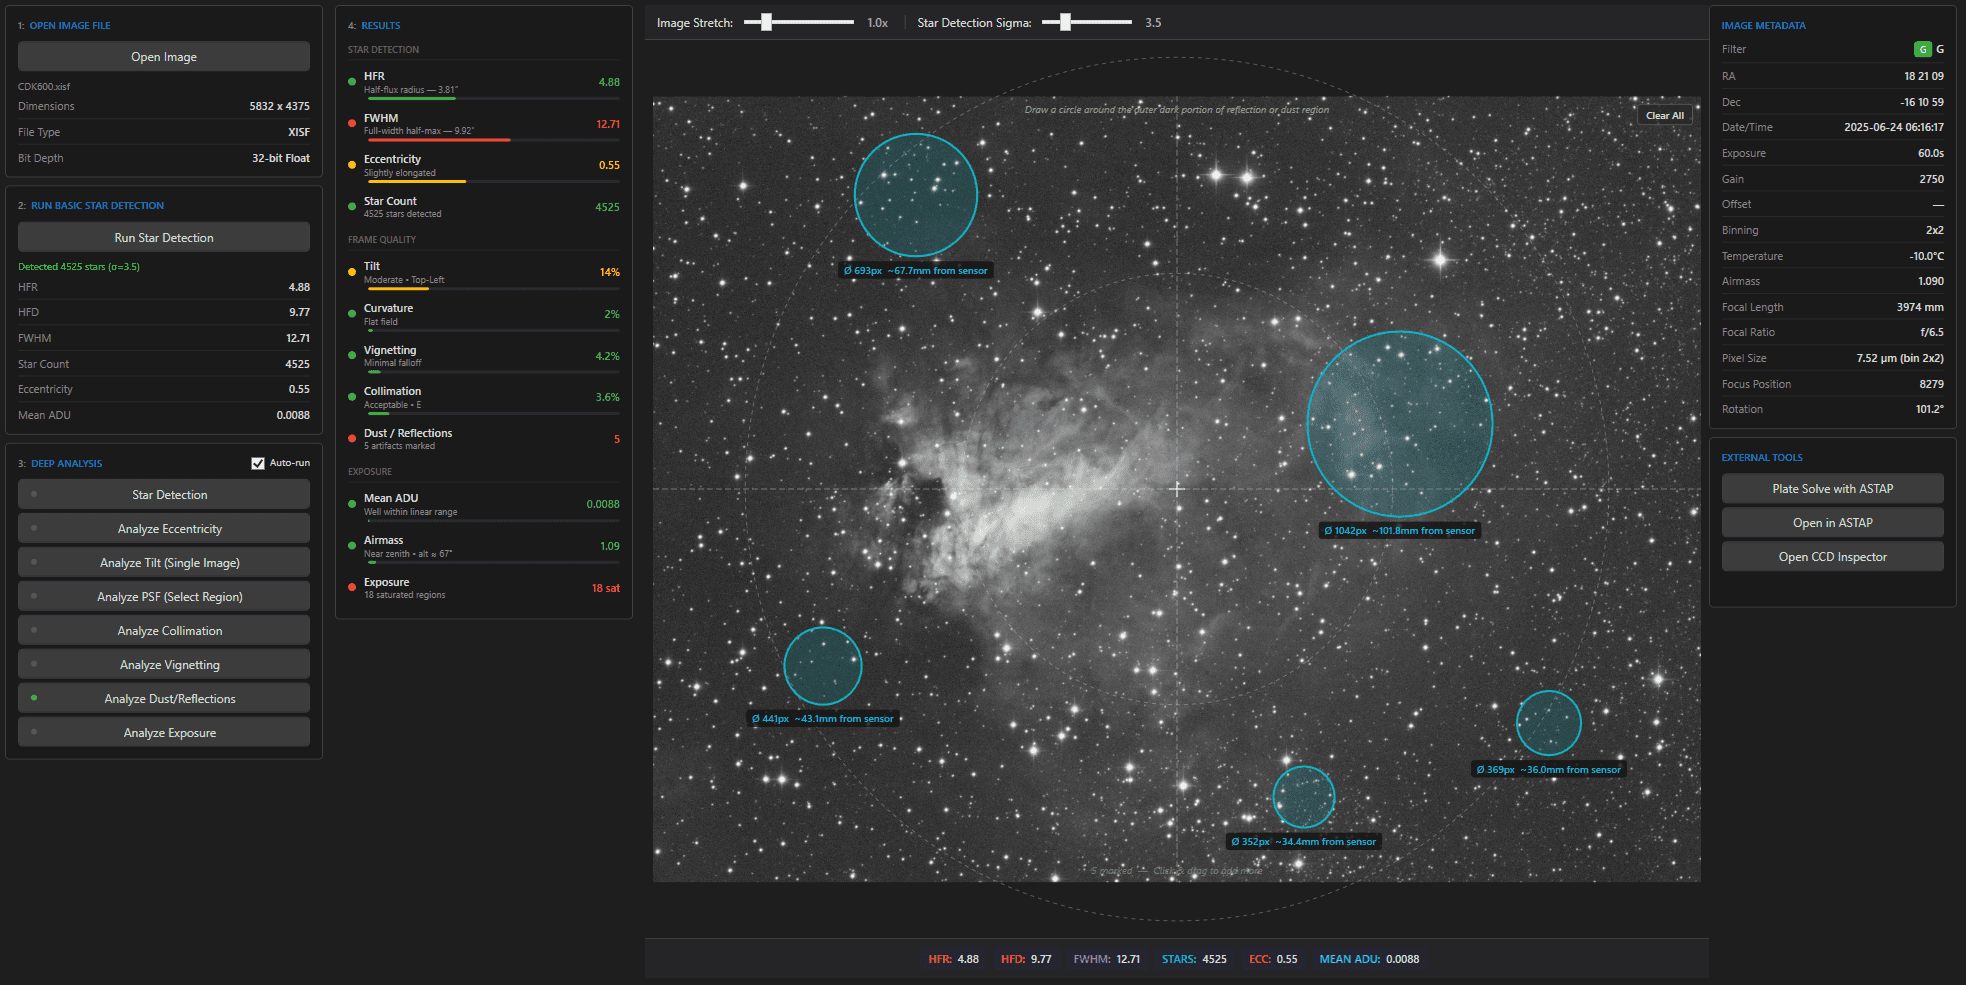
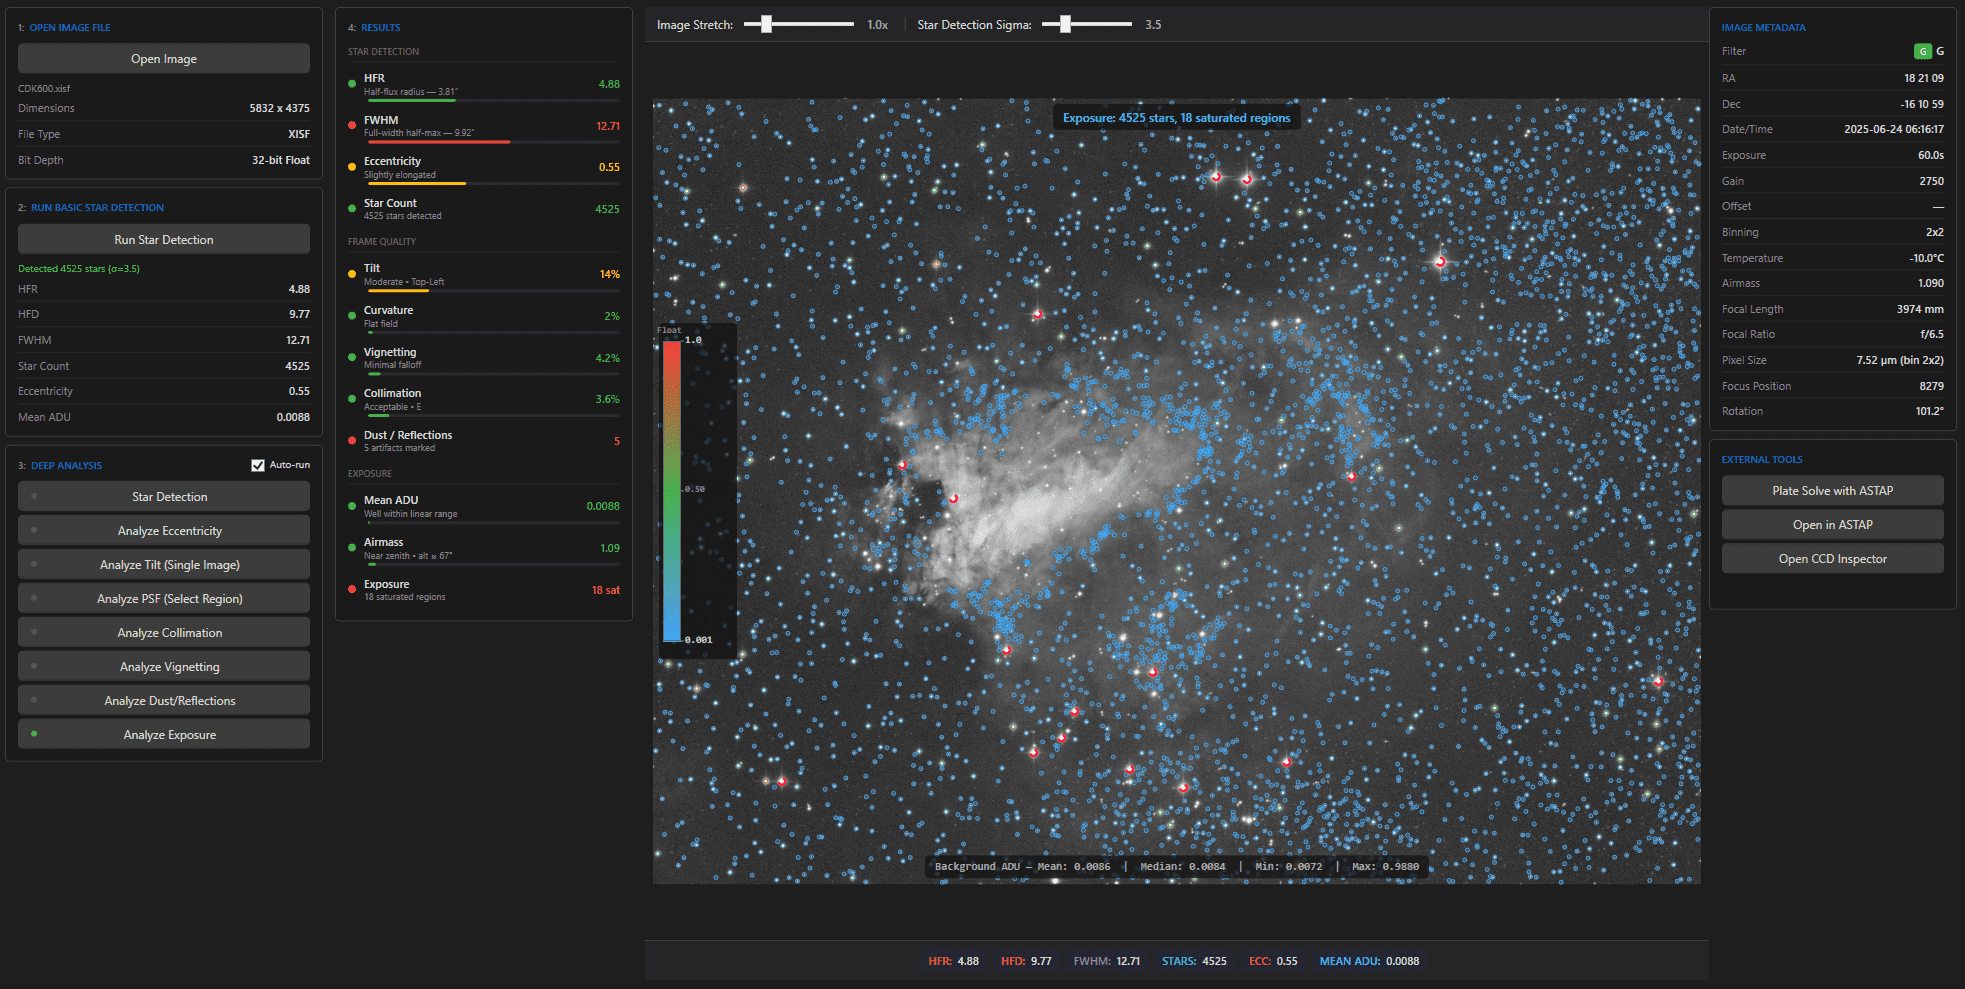
Drop a FITS or XISF sub onto the inspector and get a full diagnostic panel: star statistics, zone-by-zone HFR and eccentricity, tilt, curvature, collimation, vignetting, dust artifacts, and exposure grading — all from one frame.

Every measurement is computed from this single-image view. Use it to grade a night’s subs, diagnose a tricky optical issue, or sanity-check a new equipment change.

Star Detection

Automatic star detection identifies every star in the frame with a configurable threshold. Each detection reports HFR, FWHM, peak intensity, Gaussian fit quality, and position.

Use our SubInspector for per filter and per night inspection with blink capability and graphs to help visualize the nightly run performance.

Eccentricity

Every detected star is measured for eccentricity and elongation angle, revealing whether distortion is uniform (guiding or tracking) or directional (coma, astigmatism, flexure).

Per-star and per-zone eccentricity graphs expose patterns across the field — not just a single average number for the frame.

Tilt & Curvature

The frame is divided into nine zones and HFR is averaged per zone to reveal focus-plane tilt across three axes — catching tilted sensors, misaligned filter wheels, and mechanical flexure.

A separate curvature model distinguishes real field curvature from tilt, so you know whether to shim the train or accept the edge softness.

Collimation

Per-zone eccentricity is compared against the frame center using an asymmetry score that flags miscollimation in reflectors, RCs, and fast refractors before it shows up in your stacks.

The direction of the asymmetry tells you which way to adjust — not just that something is off.

Vignetting

Visualize light falloff from the center out to every corner of the frame, with a quantitative brightness curve that makes even small losses obvious.

Adjustable horizontal and vertical sample placement lets you walk measurements across the frame — so you can trace exactly where the falloff begins and isolate whether it’s coming from the optics, a filter, or an off-square adapter.

Dust & Reflections

Automatic detection of dust donuts, scratches, and internal reflections. Draw and identify on the frame with size and intensity so you know exactly what to clean and where.

Spot bright-star reflections and ghosting from filters or optical elements — the kind of issue that can ruin a stack.

Exposure Grading

Background level, saturation, histogram shape, and read-noise headroom are evaluated against your camera to spot overexposed regions of an image.

Find out whether your sub length is actually doing work — or if you’re shooting longer than your skies can justify.

3D PSF Viewer

An interactive 3D surface plot of any selected star’s point-spread function. Rotate, zoom, and examine the exact shape of your star profiles with mouse controls.

Full FITS header integration extracts RA, declination, filter, exposure time, and equipment metadata. Send images directly to ASTAP for plate solving without leaving the inspector.

Grade your subs before you stack.